




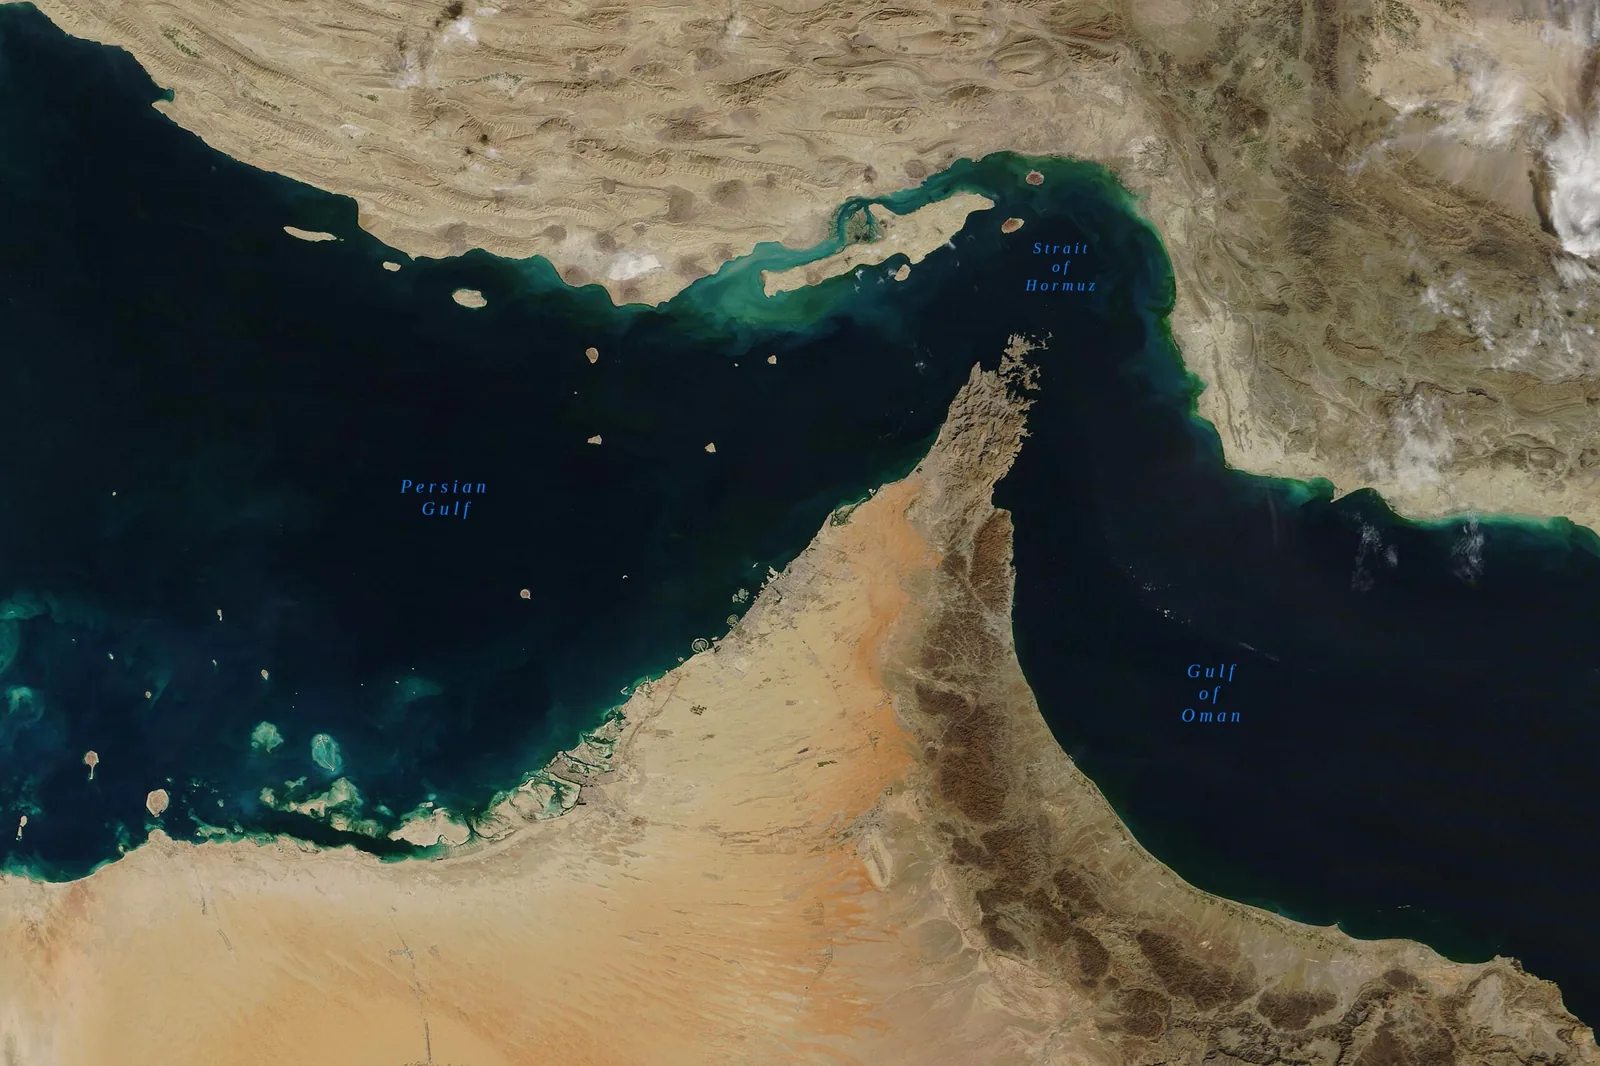
The Strait of Hormuz remains the most critical chokepoint in the global energy supply chain, and the current outlook for the end of March 2026 suggests a dramatic departure from historical norms. Typically, this waterway sees between 70 and 90 transit calls daily. However, the data points toward a significant contraction in activity as we approach the final week of the month.
Read more Bitcoin price on March 18?
Recent Developments and Context
To understand where we are heading, we have to look at the specific mechanics of the reporting source. The IMF Portwatch system tracks “Arrivals of Ships” using AIS data, covering everything from massive crude tankers to container ships. Here is what is shaping the current expectations:
- The 7-Day Moving Average Lag: The resolution depends on the 7-day moving average as of March 31. This means that even if the Strait were to suddenly reopen or close in the final 48 hours, the average would be anchored by the preceding five days of data. Any sustained disruption starting in mid-March has a mathematical “drag” that makes a low-range outcome much more probable.
- Security and Insurance Constraints: Reports from major maritime hubs indicate that War Risk insurance premiums for the Persian Gulf have reached levels that effectively ground standard commercial traffic. When insurance becomes prohibitive, the “Arrivals” count in Portwatch drops almost instantly as ships divert or anchor outside the high-risk zone.
- Carrier Diversions: Major shipping alliances have historically shown that they prefer the costly detour around the Cape of Good Hope or holding pattern strategies when regional tensions spike. We are seeing a repeat of the “Red Sea effect,” but localized to the entrance of the Gulf.
The Leading Candidate: 0 to 10 Average Daily Transits
The most likely outcome is currently the 0 to 10 range. Why such a low number? It implies a near-total cessation of commercial traffic. For the 7-day moving average to fall into this bracket by March 31, the Strait would need to be effectively impassable or officially closed to commercial transit for the majority of the final week of March. Given the current trajectory of regional maritime security reports, a “wait and see” approach by global shipping firms is resulting in an empty queue at the mouth of the Strait.
Read more How many ships transit the Strait of Hormuz this week? (Mar 10-16)
Comparison with Competitors
The 10 to 20 range is the primary alternative, representing a “leakage” scenario. This would occur if a small number of state-owned tankers or “dark fleet” vessels continue to move despite the broader commercial shutdown. However, if the IMF Portwatch data—which relies on active AIS transponders—is the benchmark, many of these vessels may not be captured if they disable their tracking, further pushing the official count toward the 0-10 floor. Higher brackets, such as 30-40 or 40-50, would require a rapid de-escalation that currently lacks any supporting signals from regional diplomatic channels.
Market Sentiment Overview
Current observations show a heavy concentration of confidence in the 0-10 bracket, which currently holds a 64% probability. Interestingly, there is a significant historical volume in the 30-40 range (over 217,000 units), suggesting that earlier in the month, expectations were for a much milder disruption. The sharp pivot toward the lowest possible bracket indicates that recent events have fundamentally altered the risk profile for the end of the month.
Read more Donald Trump # Truth Social posts March 10 — March 17, 2026?
Sources :